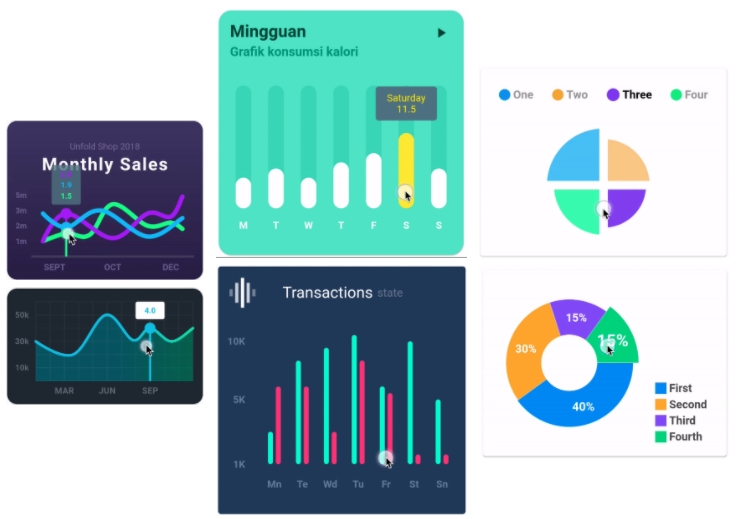
Chart and graphs are often used to illustrate a point or communicate information visually. They can be very helpful in learning about different topics, as they allow for quick comparisons between multiple data sets.
Flutter doesn’t lack number when it comes to visual data packages. In this blog post, we’ll take a look at some of the most popular charts and graphs packages in Flutter that one might use in their projects.
Table of Contents
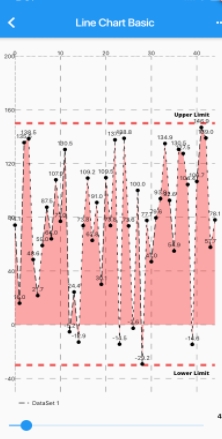
fl_chart
This is a powerful Flutter chart library which supports Line Chart, Bar Chart, Scatter Chart and Pie Chart.
LineChart(
	LineChartData(
	gridData: FlGridData(
	show: true,
	drawVerticalLine: true,
	getDrawingHorizontalLine: (value) {
	  return FlLine(
	    color: const Color(0xff37434d),
	    strokeWidth: 1,
	  );
	},
	getDrawingVerticalLine: (value) {
	  return FlLine(
	    color: const Color(0xff37434d),
	    strokeWidth: 1,
	  );
	},
	),
	titlesData: FlTitlesData(
	show: true,
	bottomTitles: SideTitles(
	  showTitles: true,
	  reservedSize: 22,
	  getTextStyles: (value) =>
	      const TextStyle(color: Color(0xff68737d), fontWeight: FontWeight.bold, fontSize: 16),
	  getTitles: (value) {
	    switch (value.toInt()) {
	      case 2:
	        return 'MAR';
	      case 5:
	        return 'JUN';
	      case 8:
	        return 'SEP';
	    }
	    return '';
	  },
	  margin: 8,
	),
	leftTitles: SideTitles(
	  showTitles: true,
	  getTextStyles: (value) => const TextStyle(
	    color: Color(0xff67727d),
	    fontWeight: FontWeight.bold,
	    fontSize: 15,
	  ),
	  getTitles: (value) {
	    switch (value.toInt()) {
	      case 1:
	        return '10k';
	      case 3:
	        return '30k';
	      case 5:
	        return '50k';
	    }
	    return '';
	  },
	  reservedSize: 28,
	  margin: 12,
	),
	),
	borderData:
	  FlBorderData(show: true, border: Border.all(color: const Color(0xff37434d), width: 1)),
	minX: 0,
	maxX: 11,
	minY: 0,
	maxY: 6,
	lineBarsData: [
	LineChartBarData(
	  spots: [
	    FlSpot(0, 3),
	    FlSpot(2.6, 2),
	    FlSpot(4.9, 5),
	    FlSpot(6.8, 3.1),
	    FlSpot(8, 4),
	    FlSpot(9.5, 3),
	    FlSpot(11, 4),
	  ],
	  isCurved: true,
	  colors: gradientColors,
	  barWidth: 5,
	  isStrokeCapRound: true,
	  dotData: FlDotData(
	    show: false,
	  ),
	  belowBarData: BarAreaData(
	    show: true,
	    colors: gradientColors.map((color) => color.withOpacity(0.3)).toList(),
	  ),
	),
	],
       )
)
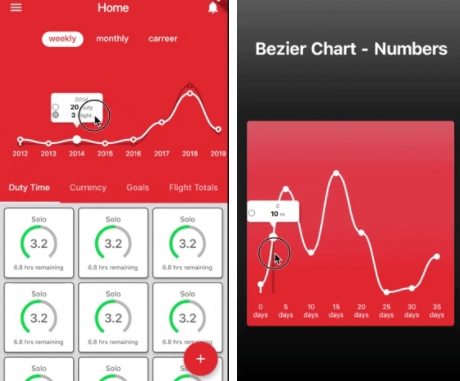
bezier_chart
This package can be used to create beautiful bezier line chart widget which is highly interactive and configurable. It supports multi bezier lines with numbers and datetimes, gestures support like touch, pinch/zoom, scrolling.
BezierChart(
    bezierChartScale: BezierChartScale.CUSTOM,
    xAxisCustomValues: const [0, 5, 10, 15, 20, 25, 30, 35],
    series: const [
      BezierLine(
        data: const [
          DataPoint<double>(value: 10, xAxis: 0),
          DataPoint<double>(value: 130, xAxis: 5),
          DataPoint<double>(value: 50, xAxis: 10),
          DataPoint<double>(value: 150, xAxis: 15),
          DataPoint<double>(value: 75, xAxis: 20),
          DataPoint<double>(value: 0, xAxis: 25),
          DataPoint<double>(value: 5, xAxis: 30),
          DataPoint<double>(value: 45, xAxis: 35),
        ],
      ),
    ],
    config: BezierChartConfig(
      verticalIndicatorStrokeWidth: 3.0,
      verticalIndicatorColor: Colors.black26,
      showVerticalIndicator: true,
      backgroundColor: Colors.red,
      snap: false,
    ),
  )
syncfusion_flutter_maps
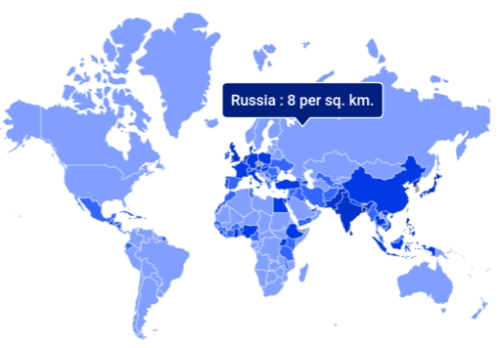
This package is written natively in Dart for creating beautiful map chart. Maps created from this library comes with many features, including tile rendering from OpenStreetMap, Bing Maps, and other tile providers with marker support and shape layer with features like selection, legends, labels, markers, tooltips, bubbles, color mapping, and much more.
fl_animated_linechart
This library only supports line and area chart types. However, it help bring animation to these charts out of the box.
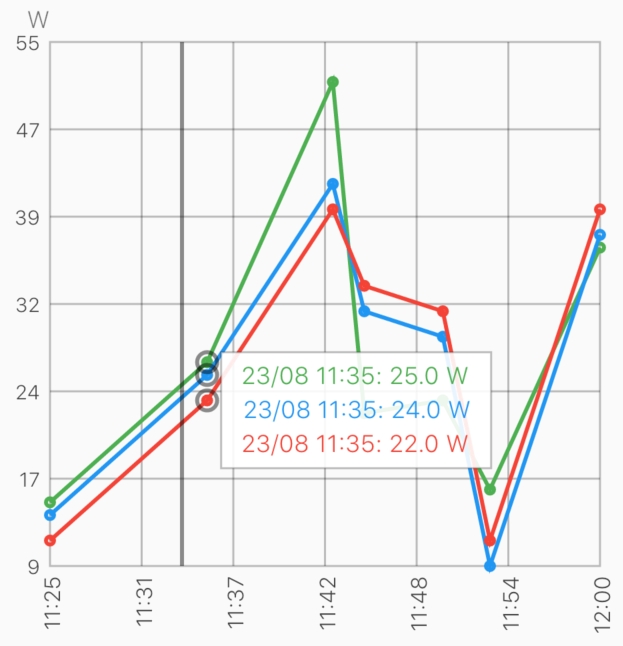
It supports for datetime axis, multiple y axis with different units.
LineChart lineChart = LineChart.fromDateTimeMaps([line1, line2], [Colors.green, Colors.blue]);

return Scaffold(
  appBar: AppBar(
    title: Text(widget.title),
  ),
  body: Container(
    child: Column(
        mainAxisSize: MainAxisSize.max,
        mainAxisAlignment: MainAxisAlignment.spaceBetween,
        crossAxisAlignment: CrossAxisAlignment.stretch,
        children: [
          Expanded(child: AnimatedLineChart(lineChart)),
        ]
    ),
  ),
);
mp_chart
If you know MPAndroidChart, you will like this library, which is its Flutter port. mp_chart supports many chart types, including line, bar, pie, scatter, bubble, candlestick, radar, and real-time chart.
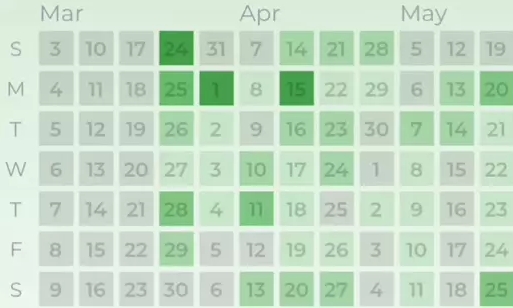
heatmap_calendar
This can be used to create a calendar chart type with emphasized color like contributor chart on Github.
HeatMapCalendar(
  input: {
    TimeUtils.removeTime(DateTime.now().subtract(Duration(days: 3))): 5,
    TimeUtils.removeTime(DateTime.now().subtract(Duration(days: 2))): 35,
    TimeUtils.removeTime(DateTime.now().subtract(Duration(days: 1))): 14,
    TimeUtils.removeTime(DateTime.now()): 5,
  },
  colorThresholds: {
    1: Colors.green[100],
    10: Colors.green[300],
    30: Colors.green[500]
  },
  weekDaysLabels: ['S', 'M', 'T', 'W', 'T', 'F', 'S'],
  monthsLabels: [
    "",
    "Jan",
    "Feb",
    "Mar",
    "Apr",
    "May",
    "Jun",
    "Jul",
    "Aug",
    "Sep",
    "Oct",
    "Nov",
    "Dec",
  ],
  squareSize: 16.0,
  textOpacity: 0.3,
  labelTextColor: Colors.blueGrey,
  dayTextColor: Colors.blue[500],
)