Multiple axes, also known as the dual-axis chart, make use of two axes to show the connection between two variables easily with different scales and magnitude of size. The connection between the two variables is called correlation.
Table of Contents
What is a Dual Axis Chart?
A dual-axis chart is a chart that displays two sets of data in the same plot area. The purpose of this type of visualization is to show how one set of data changes concerning another.
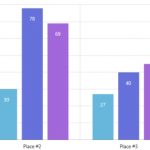
For example, you can see here how we have plotted personal expenses for Tim and Jane so you could visually compare their monthly spending habits side by side.
This technique also allows viewers to visualize comparisons between both quantitative and qualitative information simultaneously. For instance, if your audience needs to understand whether an increase or decrease in sales corresponds with higher or lower profits per customer on average, then using a dual-axis graph would be appropriate as it will allow them not only to see what happened but also why it happened.
With this char, you are merging many charts and putting in a second y-axis for assessment. Data visualization community members are skeptical regarding the application of this chart as it can be puzzling and confusing, misleading for some, and poorly designed.
How to Make
It is easy to make this chart; all you need is to follow these steps:
- Partake infogram to create a dual-axis chart
- Choose a chart type, line chart, column, grouped columns as well as line chart.
- Copy and paste or upload the data
- Customize labels, colors as well as fonts
- Embed it on your site or download it.
Best Practices
Ensure the y-axes are related: this chart can be valuable when evaluating values that have diverse units of measurement as the things they evaluate are related in a meaningful manner. So, see to it that the axes are assisting you in telling the story efficiently.
Put the y-axis on the left side: Ensure more vital variables are positioned there.
Utilize Contrasting colors: Ensure to color-code your chat to make it simple to comprehend the data you have placed. You can use a contrasting colors to determine from one another easily.
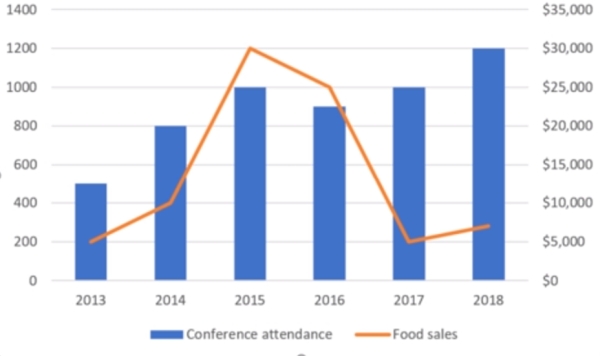
Take this chance to show you have completed your research and provide diversity to the data. You can use this chart to evaluate units sold, revenue, volume, and price. When using the same units of measurement, ensure both y-axes are scaled differently.
Using many lines for the chart is acceptable, even if it runs the risk of being cluttered. It is highly recommended to compare more variables when making a chart. Keep in mind that for the correlation that doesn’t equate to causation, other aspects might have affected the data and become unnoticed.