You always see column charts in books, newspapers, magazines, and online resources. It makes articles presentable, organized, and credible. But what is a column chart? Good question and you have come to the right place.
Table of Contents
Overview of Column Chart

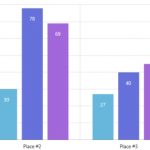
Known as a data visualization tool, a column chart has different categories represented using a rectangle. It is also called a vertical bar chart.
A column chart is a graphical representation of data in which the horizontal axis is on an arbitrary scale (usually, but not always from low to high) and points are plotted vertically according to their values.
Column charts can be used for presenting multi-dimensional data with two or three dimensions being shown at once through multiple series of columns. The first dimension typically represents different categories; the second usually shows aggregate quantities within these categories; and the third may show percentages that represent a specific value as a proportion of total occurrences.
Different Types of column charts:
The column chart comes with several variants. Aside from the clustered column chart, stacked column chart, and small multiples, the column chart is available with bar chart and pictograph column chart.
A lot of people are confused between a bar chart and a column chart because of the similarities. But they are different. The bar chart, for example, is rotated by 90 degrees. Then, the data are represented by the width of various bars.
Why Should You Use a Column Chart?
Generally, a column chart allows everyone to present data in an organized, presentable, and accurate manner. It also offers other benefits highlighted below:
- The information has a small number of simple and useful categories. This guides the reader to analyze and understand any type of information within a short span of time.
- It is used to compare the values of different categories. Comparing different data without a chart is difficult. Using one makes it easier than ever.
- Simple information presentation. Unorganized data is hard to examine and comprehend. Presenting information in a column chart can save your time and reduce other unnecessary efforts in the long run.
Some of the Drawbacks
Similar to other options, column charts have a few drawbacks. Here are a few of their limitations:
The number of categories is larger than you have ever expected. Better alternatives include donut charts, bubble clouds, word clouds, and pie charts.
It only represents a small count of values. Don’t worry! You can try minimal column charts a pictograph column charts if the need arises.


