When it comes to debugging in Android, developers all think of Android Debug Bridge (adb) which is a versatile command line tool which allows developer to communicate with an emulator instance or connected Android-powered device. There are many external libraries and tools which can make debugging process easier and better. Following are some of them:
Table of Contents
Stetho
Stetho is a powerful debug bridge for Android applications developed by Facebook. It allows developer to use the powerful Chrome Developer Tools natively to inspect Android app. For example, Stetho can help check SQLite database easily without using DDMS tool.
With Stetho, developers can inspect the application’s network traffic, view and modify the application’s SQLite database, and analyze the hierarchy and properties of the UI components.
Key Features:
- Network Inspection: Monitor and analyze network requests made by the application, including headers, request, and response bodies.
- Database Inspection: Access and modify the application’s SQLite database to examine and manipulate data.
- View Hierarchy Inspection: Visualize the UI component hierarchy and inspect their properties, facilitating UI debugging.
LeakCanary
Memory leaks are a common issue in Android development, leading to sluggish performance and potential crashes. LeakCanary is a memory leak detection library that helps identify memory leaks in Android applications. It automatically detects and reports memory leaks, providing detailed information about the leaking objects and their references.
Key Features:
- Automatic Leak Detection: Detects memory leaks without requiring explicit configuration or manual checks.
- Leak Analysis: Provides detailed information about the leaking objects, their references, and the leak trace.
- Integration with Android Studio: Easily integrates with Android Studio for a seamless debugging experience.
Firebase Crashlytics
Firebase Crashlytics is a robust crash reporting and analysis tool offered by Google. It helps developers track and analyze application crashes in real-time, providing insights into the root cause of crashes, affected devices, and user flows leading to the crash. Crashlytics also provides powerful logging capabilities, allowing developers to log custom events and debug information to aid in crash investigation.
Key Features:
- Real-time Crash Reporting: Get notified instantly when an application crash occurs, with detailed crash reports.
- Crash Insights: Understand the root cause of crashes, including stack traces, affected devices, and user flows leading to the crash.
- Custom Logging: Log custom events and debug information to track user behavior and capture additional context.
Lynx
Debugging Android applications can be a challenging task, especially when it comes to understanding the logs generated by the system. The Android logcat provides valuable information about the app’s behavior, including log messages and exceptions. However, navigating through the logcat output and extracting meaningful insights can be time-consuming and cumbersome. This is where the Lynx library comes to the rescue.
Lynx is an Android library specifically designed to simplify the process of debugging and analyzing logcat output. It offers a custom view that neatly displays all the information typically printed in the Android logcat, including various levels of log messages and application exceptions. With Lynx, developers can effortlessly filter log traces, share logcat output with other apps, and configure settings such as the maximum number of traces to display or the sampling rate.
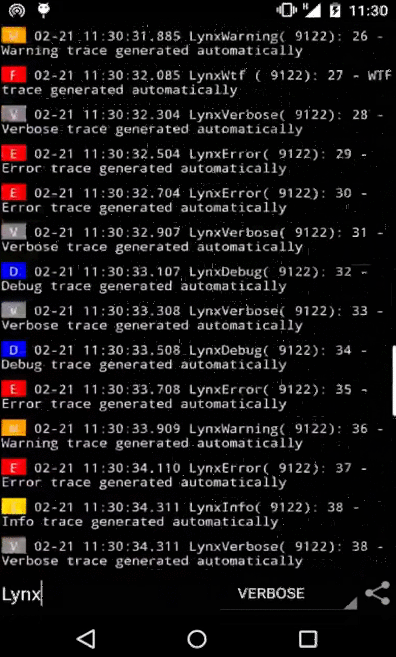
Lynx shows a list view of all the information Android logcat is displaying. Different traces of different levels from log messages to app’s exception ones are displayed on screen. You can filter these traces, share the logcat to other apps. The max number of traces can be set to show.
Android Studio Debugger
Android Studio, the official Integrated Development Environment (IDE) for Android, comes equipped with a robust debugger. This tool allows developers to set breakpoints, step through code, inspect variables, and evaluate expressions at runtime. The Android Studio debugger provides a visual representation of the call stack, allowing developers to trace the flow of execution and pinpoint the exact location of bugs.
Key Features:
- Breakpoints: Set breakpoints at specific lines of code to pause execution and examine program state.
- Variable Inspection: View and modify variable values at runtime to understand their impact on program behavior.
- Step-by-Step Execution: Step through code one line at a time to identify the cause of unexpected behavior.
- Conditional Breakpoints: Set breakpoints that only trigger when specific conditions are met.
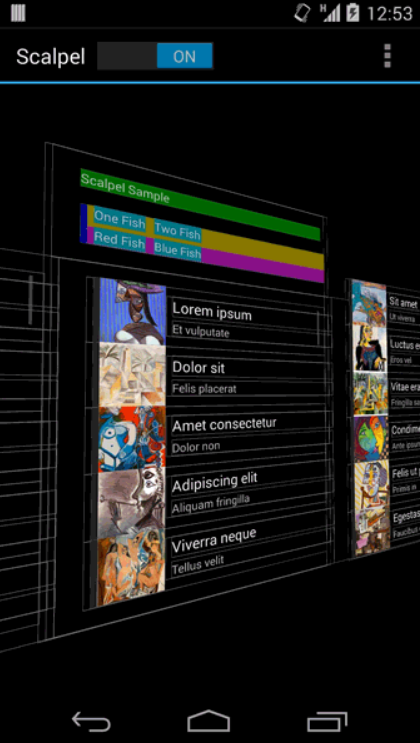
Scalpel
Scalpel is a surgical debugging tool to uncover the layers under an app. The tool displays app’s layer under 3D mode for better visual.
It was deprecated. Android Studio supports this out of the box.