Even though both Dalvik and ART optimize RAM usage with garbage collection (GC), it doesn’t mean a developer can do whatever they want without checking how an app allocates and releases RAM.
Table of Contents
How to trigger memory leaks
Developers need to aggressively stress their app code and try forcing memory leaks. They should let the app run for several hours before checking the heap. The smaller the leak, the longer an app should be run to see it.
The following are 2 ways to trigger memory leaks:
1) Switch back and forth between portrait and landscape mode multiple times while in different activity states.
2) Switch between your app and another app while in different activity states.
Investigating RAM usage
Google provides a detailed guide about analyzing how RAM is used in an app. It can be read here.
Fortunately, there is a library called LeakCanary that can help you avoid working with heap dump.
Using LeakCanary to detect the leak
LeakCanary is a memory leak detection library for Android and Java.
Steps to use LeakCanary:
1) Add the following lines to build.gradle
dependencies {
debugCompile 'com.squareup.leakcanary:leakcanary-android:1.4-beta2'
releaseCompile 'com.squareup.leakcanary:leakcanary-android-no-op:1.4-beta2'
testCompile 'com.squareup.leakcanary:leakcanary-android-no-op:1.4-beta2'
}
2) Initialize the library
public class ExampleApplication extends Application {

@Override public void onCreate() {
super.onCreate();
enabledStrictMode();
LeakCanary.install(this);
}

private void enabledStrictMode() {
if (SDK_INT >= GINGERBREAD) {
StrictMode.setThreadPolicy(new StrictMode.ThreadPolicy.Builder() //
.detectAll() //
.penaltyLog() //
.penaltyDeath() //
.build());
}
}
}
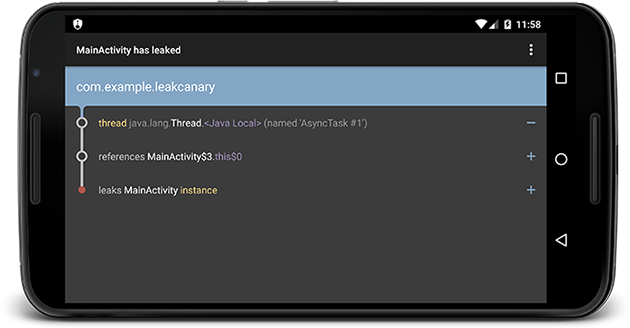
3) Check for leaks in a nice display