A radar chart is a manner of measuring many quantitative variables, which makes it valuable for seeing which variables have the same values or when there are outliers among each variable. This type of chart is also valuable for knowing which variables scores high or low in a data set, which makes it perfect and ideal for showing performance.
A radar chart is popular in various names including spider chart, star chart, cobweb charts, star plot, web chart, polar chart, Kiviat diagrams as well as an irregular polygon. It is equal to a similar coordinate’s plot that has axes placed radially.
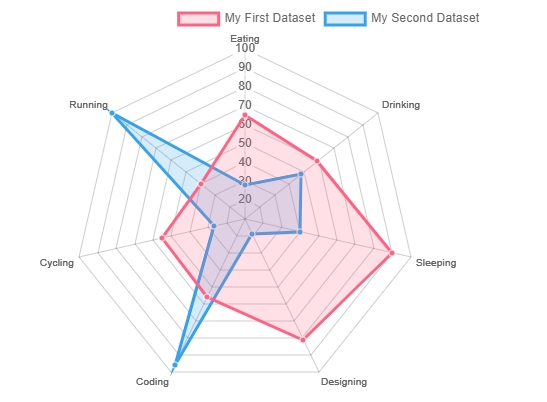
Each variable is given with an axis that begins from the middle. The entire axis is sorted out radially, with the same distances between each other while keeping a similar scale between the entire axes. A grid line which links from one axis to other serves as a guide. The value of each variable is plotted together with its individual axis. The whole variables in the dataset are linked together in order to make a polygon.
The main advantage of a radar chart is that it allows for more data to be shown than with a line graph. This means you can show your audience how one value changes in relation to many others at the same time, without having to selectively pick which ones are important enough to include on the graph. It’s perfect when you’re trying to compare the relationship between two or more sets of values over an extended period of time, and gives viewers plenty of information about how those numbers changed against each other so they could make their own conclusions as well.
Despite the many perks it provides, there are some flaws in using this kind of chart, such as:
- Having many polygons in a single chart makes it difficult to read and understand, confusing, as well as very messy, most particularly when it is filled with polygon, as the top ones cover the entire polygons below.
- Having lots of variables makes too much axis and can make the chart difficult to understand. Therefore, it is best to keep it simple, and as much as possible, you have to restrict the number of variables used. Another drawback of this chart is that it is not good for measuring values in every variable, even with the support of a web-like grid guide. Evaluating values on one straight line is easier.